
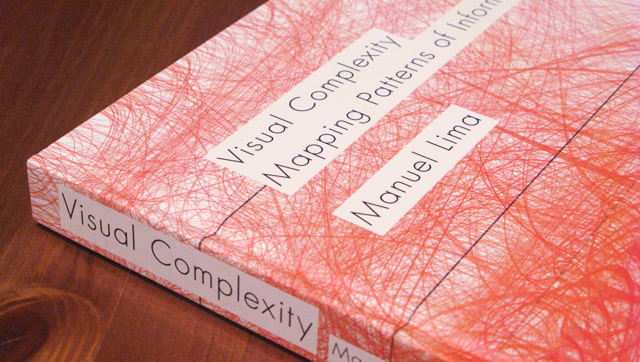
At first glance, "Visual Complexity" by Manuel Lima [Amazon US | Amazon UK] looks like just another collection of pretty data visualisations, of the kind popularised by the data wizards at the NY Times and The Guardian, or by gurus such as Edward Tufte. And it certainly is pretty, but there's much more to it than that. It's also an exploration of how people have tried to organise information through history, and where traditional approaches break down in face of complex data. Lima then describes how to address such complex information in graphs or networks, and outlines how we can better understand such information by visualising it.
The traditional way to deal with complex information is the principle of "divide and conquer". That is, divide the information into smaller parts, then subdivide again. This inherently produces tree structures, or hierarchies, and there are many examples of these. The book mentions Aristotle's subdivision of species, the Dewey decimal classification system for libraries and many more. Also consider how such hierarchies appear in power structures of church and state, or in traditional "org charts" for large businesses. Or, in the geographical subdivisions of country, state, city and borough.

This works to an extent, but it breaks down in the face of many real world cases. Often, there is no "top" or "root node" that everything springs out of, no starting point from which to navigate the data. What's more, individual entities don't necessarily fit in a single category. And there are important relationships between individual entities that span across categories.
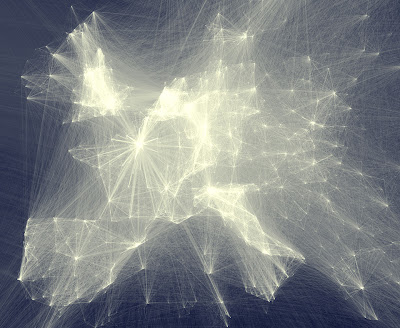
This inevitably leads to modelling information as networks of entities, in other words graphs. Such graphs appear everywhere once you start looking for them, examples mentioned in the book include: interactions between species in an ecosystem, social interactions between people, transport networks, the structure of the Internet, trade flows between countries, interactions between proteins in living organisms. I might add: the dependencies between complex financial products, relationships between corporate entities, the flow of money in financial systems. The list just goes on.
Lima describes the limitations of trees, the move towards graphs and then sets out to describe how to analyse information in such graphs. The problem with graphs is that traditional visualisation techniques break down: they can't cope with the inherent interconnectedness of entities that graphs contain.
To address this, Lima first catalogues a large number of graph visualisations that have been published over the years (he also curates these at http://www.visualcomplexity.com/vc/ to preserve these for posterity). Then, he proceeds to distil a pattern language from these cases, or as he describes it "a syntax for a new language". This includes techniques such as "area grouping", "circular ties" and many more, each richly illustrated with specific examples.

Finally, the book makes the leap to the use of networks and graph structures in visual arts, as illustrated by the idea of "networkism". This is perhaps less directly useful to the working data analyst but fascinating nonetheless.
To summarise, this book is an ambitious attempt at explaining the reason why graphs are important, as well as a catalogue of techniques to address the visualisation of this kind of data. The key point Lima makes is that graphs aren't just another kind of data structure, they are inherently structures of complex data. I think Manuel Lima pulls all of this off admirably, and I highly recommend the book to anyone interested in data analysis, modelling and visualisation.
Finally, I'd like to point out: this book is gorgeous. The many graph visualisations are printed in full colour and with the high resolution needed to make out the super-fine detail present in many of them. This is definitely a book you'll want as a paper copy and not on your e-reader.
No comments:
Post a Comment